Category Archives: Demonstration Projects

Posts related to in-process activity. See the “New Stuff” page for an overview of current projects.

Business Analytics Modeling Demonstration Project

Business analytics are the distillation of “big data” that is actually used to make decisions.  Surprisingly, business analytics are rarely included in the data models used to build the EDW.  More often, BI designers model analytics in the BI tool metadata, assuming that the EDW data model and physical structure will support those analytics.  Surprises occur at this point!  This project suggests best practices and tools for integrating business analytics into the EDW data modeling process to create better BI solutions.

What is a Business Analytics Data Model?

BI solutions typically involve many thousands of data objects.  BI dimensional data modeling is often tasked to capture all “potentially useful” source elements for the target subject area.  This largely source-driven approach can lead to a “boil the ocean” effort that delays the deployment of useful BI reporting.  To enable a more direct path to BI results, business analytic objects are integrated with the BI dimensional model.  The process is a convergence of source/target-driven and analytics-driven modeling.

A Business Analytic Data Model is an enriched form of the BI dimensional data model that includes analytic data objects.  Analytic data objects directly influence manual or mechanized decision making, are predictive as well as historical in nature, and can be derived from structured and non-structured data.

Business analytics are the lynch-pins that unite business requirements analysis with data modeling.  Data requirements emerge by decomposing the business analytics.  Modeling from business analytics to the required data reveals gaps or structural problems in the data model that might be missed by traditional source-to-target BI dimensional data modeling.  Each approach compliments the other in getting to the best solution in the shortest time.

What are the Goals of a Business Analytics Data Model?

Business analytics modeling can help solve three major BI/EDW challenges:

    1. Aligning business and IT stakeholders in the process of developing of BI/EDW solutions
    2. Ensuring that the EDW data model will support the business reporting requirements
    3. Establishing a framework for overall business performance management

On the surface, these challenges read like general requirements that would apply to any BI/EDW initiative. But why are they so incredibly difficult to achive?  And how can a business analytics model help?  Let’s address those questions one at a time.

Aligning Business and IT Stakeholders

IT and business stakeholders want the same thing in the end — a succesful BI solution that benefits the organziation and all involved.  But they approach the journey from different perspectives.

IT-Business Alignment

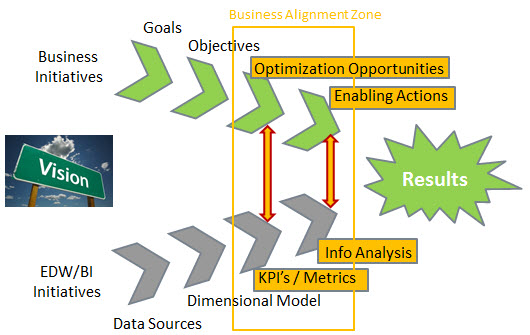
There is a critical point where the business and IT journeys converge, and that is when the business analytics are formulated.

BUSINESS VIEW: Business analytics measure the optimization opportunity — How well are we doing?  How big is the prize?  Analytics suggest or trigger enabling actions to achive the opportunity.

IT VIEW:  Business analytics are the nucleus of a mini-data model that collectively stretch into all corners of the dimensional model, and back to the data sources.

If we can get the IT and business collaboration right during this critical stage, the probablity of a successful BI/EDW result will be improved.  Future posts will present some business analytics modeling methods, and pitfalls to avoid, gleaned from many BI projects undertaken by Brightlight and yours truly.

Ensuring that the EDW data model SUPPORTS business analytics reporting

<in process>

Establishing a framework for business performance management

<in process>

************

I would like your insights on business analytics modeling challenges you have encountered at your companies.  Please use the comment form at the end of each post.  I will respond and try to incorporate your ideas into the demonstration project.
Flexible Hierarchies Demonstration Project

Business hierarchies are the “crown jewels” of an analytic-driven organization.  They encode the analytic framework for marketing, product and sales management, and competitive benchmarking.  This project will walk you through the steps to create a high-performing EDW model for dynamic, flexible business hierarchies.  The project will provide technical artifacts for a Netezza DW appliance solution, but the modeling concepts are applicable to other EDW platforms.  I will post on this site progress of this project journey, and invite your suggestions and stories from your own experiences.  You can reply using the commenting dialog at the end of each post.

In this project I will layout a modeling approach and a prototype for hierarchies that work the way you want, and they way Chelsea in finance wants, and Joe in marketing wants, and your merchandising director and suppliers want.  The result is a compendium of approaches I have used at various clients in several industries over the last six years, born out of lot of listening and technical experimentation, and tempered with published research from DW gurus like Ralph Kimball and Joe Celko.  I’m certain to have violated some rules along the way, but my view is that things that actually get used leave a trace of broken rules in pursuit of the greater good.

First, the requirements.  Below is a list of “We needs” that come up time again when discussing hierarchy requirements with business folks:

    • We need to report the same sales data by different roll-up hierarchies
    • We need hierarchies that can report summary results consistently across business units.
    • We need hierarchies that support a variable number of levels (aka, “ragged hierarchies”)
    • We need to link related hierarchies–for example, sales organization hierarchy linked to product hierarchy
    • We need to track hierarchy changes so we can report based on the hierarchy structure today, or at any historical date.
    • We need to evaluate the impact of planned hierarchy changes simultaneously with current reporting.
    • We need to integrate external product or customer data with our internal hierarchies.
    • We need to update hierarchies with known changes in advance of the delayed feeds from external data suppliers.
    • We need to navigate the hierarchy in various ways depending on the business question.
    • We need to dynamically aggregate facts by hierarchy level or node.
    • We need to track multiple occurances of attributes such as addresses, industry codes, etc.
    • We need to handle hierarchy nodes with more than one parent (e.g, a store served by two distribution centers).
    • We don’t want to update the fact table(s) when a hierarchy changes.
    • We don’t want to rely on “meaningful identifiers” that become outdated and lead to confusion.
    • We need to build in health checks alert us to inconsistencies in the hierarchies that could distort reporting.
    • We need a standardized approach to building hierarchies that is repeatable and easy to maintain.
    • Importantly, we need to make the user interface simple and intuitive.

Whew!  That is a tall order.  When hierarchies are inflexible or difficult to change, it is nearly impossible to address more than a few these needs.  Many organizations learn to live with inflexible hierarchies.  We must change that paradigm.  The value of business nimbleness that flexible hierarchies enable will far exceed the the investment to create them.

***********

Look for upcoming posts describing a conceptual architecture for flexible hierarchies, and demonstrating an industry use case.  In the meantime, please send me hierarchy challenges you have seen in your own organizations, and I’ll reply and/or incorporate them into the demo.  Use the commenting box below.