Category Archives: Advanced Analytics / Ad-Hoc Analysis

Advanced Analytics interpret data from the stream of decisions, transactions, and events flowing into the EDW. Ad-Hoc Analysis supports the question?answer?new question style of data exploration. Used together, these tools yield the decision rules required for Operational BI. This category examines requirements for an Advanced Analytics / Ad-Hoc Reporting Workbench.

Business Analytics Modeling Demonstration Project

Business analytics are the distillation of “big data” that is actually used to make decisions.  Surprisingly, business analytics are rarely included in the data models used to build the EDW.  More often, BI designers model analytics in the BI tool metadata, assuming that the EDW data model and physical structure will support those analytics.  Surprises occur at this point!  This project suggests best practices and tools for integrating business analytics into the EDW data modeling process to create better BI solutions.

What is a Business Analytics Data Model?

BI solutions typically involve many thousands of data objects.  BI dimensional data modeling is often tasked to capture all “potentially useful” source elements for the target subject area.  This largely source-driven approach can lead to a “boil the ocean” effort that delays the deployment of useful BI reporting.  To enable a more direct path to BI results, business analytic objects are integrated with the BI dimensional model.  The process is a convergence of source/target-driven and analytics-driven modeling.

A Business Analytic Data Model is an enriched form of the BI dimensional data model that includes analytic data objects.  Analytic data objects directly influence manual or mechanized decision making, are predictive as well as historical in nature, and can be derived from structured and non-structured data.

Business analytics are the lynch-pins that unite business requirements analysis with data modeling.  Data requirements emerge by decomposing the business analytics.  Modeling from business analytics to the required data reveals gaps or structural problems in the data model that might be missed by traditional source-to-target BI dimensional data modeling.  Each approach compliments the other in getting to the best solution in the shortest time.

What are the Goals of a Business Analytics Data Model?

Business analytics modeling can help solve three major BI/EDW challenges:

    1. Aligning business and IT stakeholders in the process of developing of BI/EDW solutions
    2. Ensuring that the EDW data model will support the business reporting requirements
    3. Establishing a framework for overall business performance management

On the surface, these challenges read like general requirements that would apply to any BI/EDW initiative. But why are they so incredibly difficult to achive?  And how can a business analytics model help?  Let’s address those questions one at a time.

Aligning Business and IT Stakeholders

IT and business stakeholders want the same thing in the end — a succesful BI solution that benefits the organziation and all involved.  But they approach the journey from different perspectives.

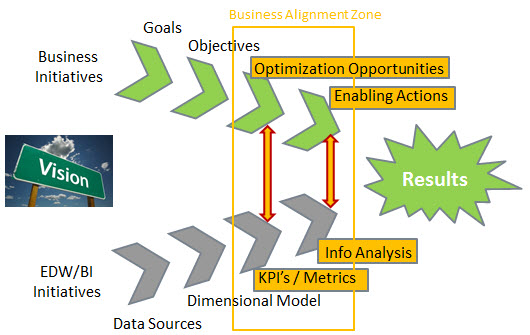
IT-Business Alignment

There is a critical point where the business and IT journeys converge, and that is when the business analytics are formulated.

BUSINESS VIEW: Business analytics measure the optimization opportunity — How well are we doing?  How big is the prize?  Analytics suggest or trigger enabling actions to achive the opportunity.

IT VIEW:  Business analytics are the nucleus of a mini-data model that collectively stretch into all corners of the dimensional model, and back to the data sources.

If we can get the IT and business collaboration right during this critical stage, the probablity of a successful BI/EDW result will be improved.  Future posts will present some business analytics modeling methods, and pitfalls to avoid, gleaned from many BI projects undertaken by Brightlight and yours truly.

Ensuring that the EDW data model SUPPORTS business analytics reporting

<in process>

Establishing a framework for business performance management

<in process>

************

I would like your insights on business analytics modeling challenges you have encountered at your companies.  Please use the comment form at the end of each post.  I will respond and try to incorporate your ideas into the demonstration project.
Cohort Analysis — understanding your customers

Dimensional BI analysis is great stuff for understanding the business, but what really makes your customer’s tick? BI techniques such as survey analysis, market basket analysis, and clickstream analysis help illuminate this universal question. But BI queries typically tells us about the “average customer” who never exists.  How many households do you know with exactly 2.6 people?   
 
Cohort Analysis comes at the customer question from a different direction. The idea is to choose specific customers first, and then dimensionally analyze their actions, and the reactions of related parties. This approach eliminates error resulting from changes in the underlying customer mix over time. In effect, the data warehouse becomes a massive pool of longitudinal study participants whom you don’t have to pay, and can be studied in seconds rather than years.

Stepwise Analysis 

Cohort Analsis is a three step process:

  1. The “design step” frames the question or hypothesis to investigate. For example,—do free breakfast upgrades measurably improve business traveler retention for a hotel chain? If there is a good correlation, then a check-in rule might be instituted to upgrade certain types of guests when room availability hits certain thresholds.
  2. The “cohort step” selects the customers to study,typically a control group and one or more target groups.  For example, “select from the EDW a list of business travelers based in the north-east market with at least one stay per quarter over the preceding four quarters”.  From this pool frequent travelers, subset a control group that did not receive the upgrades in the first quarter, and a target group that did.
  3. The “study step” compares the control and target cohorts over some time range and dimensional grouping criteria.  Any metrics or target groupings can be used in the comparisons.  Example metrics are number of stays, length of stays, revenue, non-room charges, etc.  Example dimensional groupings are weekend versus non-weekend guests, guests that had meal charges versus those that did not, etc.

Power to the People 

Ad-hoc cohort analysis requires raw horsepower for dynamic joins at the customer key level. Without the power afforded by an EDW, development staff may be needed to set up temporary database structures and batch processing–not good.  We want the business analyst to be in full control–commanding rapid study cycles in the iterative question?answer?next question approach.  For performance reasons, cohort analysis processing should take place mostly on the EDW server, not the reporting tool platform.  In addition, certain aggregate tables and views may be required in the back-end EDW. 

Cohort Analysis Workbench

A Cohort Analysis Workbench enables the analyst to save cohort stage result sets for later use as study filters.  The workbench also manages a folder-based library of cohorts and studies for comparative analysis. High-end BI tools like MicroStrategy are well suited for creating such a workbench.  MicroStrategy can publish intermediate results to SQL tables, join reports using multi-pass SQL, and manage a library of studies with appropriate security. 

A Collaborative Approach 

This is not entirely an out-of-the box solution.  The workbench should be explicitly designed and tested with a portfolio of templates and key metrics.  Fortunately, high-end BI tools and MPP EDW servers make building a cohort analysis workbench relatively quick task.  But business analyst and the BI analyst must collaborate closely to get the job done. The active ingredient is the brain of the lead business analyst.  His or her vision, sponsorship, enthusiasm and direct participation will assure success. 

* * * * *

Do you have opportunities for cohort analysis in your organization?  Comment back to this post with your objectives and challenges.  Let’s get some dialog going around this very powerful method for understanding your customers.